Collaborating in geospatial context since 2000!

Thursday, January 29, 2009

2008 NAIP Data

Jarlath mentioned recently that 4-band 2008 NAIP (National Agricultural Imagery Program) data is currently being processed for public dissemination. I am not completely sure which states, other than Vermont of course, have acquired the NAIP data with the near IR band but these status maps certianly help. These county-wide, 4-band datasets are going to be shipped in the JPEG2000 and GeoTIFF formats and if you're like me, your network gets flooded with usage during the day so downloading a large dataset gets tricky.  Not to mention that the shear number of files that get shipped with a large dataset get complicated to manage. See below that there are over 10 files that are shipped with each county set.

More often than not those of us who do download these data are really only interested in a small area like a city or county so wouldn't it be nice to be able to download a single file that ultimately holds the same information as the eleven or so files that come with the JPEG2000 Dataset? All of that information can now be contained in a single PDF file. See Below:

What about the 4th Band from the input image? No problem because there are a total of 4 bands in the GeoPDF file that can be dynamically reassigned to RGB depending on what questions you are asking from your data! Are you trying to find areas of dead or dying vegetation? You will need to look for areas with dark red to brown pixels in a color infrared image. To view the data as a color infrared view state, adjust the bands dynamically in the PDF Layers tab to 4, 1, 2.

To view the data again as natural color adjust the band combination to 1, 2, 3.

For more information on using color IR data, please check out the video by clicking here. He gives a very good desription of how to use histogram stretching in your raster data which is invaluable for producing quality mapping data! Thanks Jarlath...

Wednesday, January 28, 2009

Adobe blend methods and remotely sensed data

I mentioned in a previous post that an option to rid your imagery of the pesky collar data is to adjust the neatline to exclude it from the map frame all together. Another way to get rid of the collar data when mosaicking a set of GeoPDF files is to utilize a couple of the default Adobe blend methods. You can see in the graphic below that there is a fair amount of collar data (No DATA pixels) in the GeoPDF file.


A quick way to create a seamless mosaic from a set of GeoPDFs is to apply an Adobe blend method to the properties of each input file.


You can see in the above graphic that there are specific properties for each file that can be adjusted. These properties include, the path to the input file, the page number, description, transparency and blend mode.

Map Assembler has provided an interface between the GeoPDF and most of the Adobe Blend methods.  There are 16 blend methods to choose from and depending on your data and what the situation calls for they are all pretty useful. For continous raster data like aerial photography and satellite imagery that has collar data with all black pixels, its best to use the lighten blend method. For raster data with all white collar data, it's best to use the darken method. All in all, trial and error usually prevails like in most mapping applications! I have had the best luck with lighten and darken and that is what I recommend for this particular situation. The final seamless mosaic of all 4 adjacent tiles is below...

Labels:

Monday, January 26, 2009

How to remove NO DATA pixels from your map series

A very common issue in working with orthophotography and satellite imagery is that once the final image product has been created, there is often a fair amount of collar data (NO DATA) pixels in the image. This is caused by the inherent rotation that is applied to the image when resampling each pixel in the orthorecification process. Anyway, there is no easy way to completely delete these pixels from your imagery but there are work arounds when playing in the PDF space. Please observe the NO DATA pixels in the image below.

If there is no method of blending or cut line editing that takes place as part of a preprocessing step, these pesky pixels appear to overlap the areas with good "image" pixels when mosaicking adjacent tiles together. Observe the map that was stitched together using TerraGo's Map Assembler.

To fix this, we have to modify the neatline for each GeoPDF which will force the map canvas to cover only the image extent so that Map Assembler can stitch it together properly. Please see the before and after snap shots of the edited neatline.


After editing the neatline, you can clearly see that the NO DATA values in the graphic on the left are now removed in the graphic on the right (highlited in yellow). I edited all four images in this series to get a seamless output county mosaic. This quick and dirty edit created a single 30 megabyte GeoPDF that covered approximately 735 square miles. 

Enjoy...

Labels: ,

Friday, January 23, 2009

GeoPDF Example Gallery

If you are looking for more information on or possible uses for the GeoPDF file format, check out the newly created Geospatial and Mapping Gallery on AcrobatUsers.com. Adobe has done a wonderful job in getting this up and running and so far the community response has been outstanding!

A more in-depth gallery is on its way to the TerraGo website as well so please stay tuned!

Labels: ,

Friday, January 16, 2009

Inauguration Map

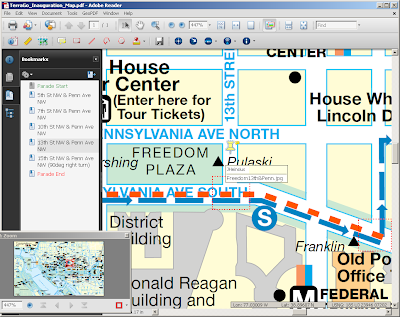
Check out the Inaguration Map for the upcoming election on the AcrobatUser.com Geospatial Gallery! Glenn beat me to the initial announcement yesterday but I thought I should expand upon what is in the map.  This GeoPDF file was created using the TerraGo Composer Suite and there are a couple things that I think are pretty cool! 

1. There are a few Bookmarks that help to identify the parade route. For a novice map user, Bookmarks are a key element for navigating through the material. 


2. Each Bookmark takes the user to a specific location in the map.

3. The Bookmarks also take you to data that was collected from the TerraGo Mobile product while out in the field on a smart phone.

The data behind each push-pin for this example is a snap shot of that area. Note that the JPEG photos are stored in the PDF!

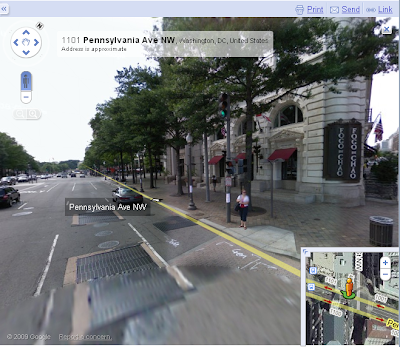
3. Finally, we have included a link to the Google Maps page with the Street View open for each section. I think the more elegant approach would have been to embed the Street View link directly in the PDF but this'll do...

Thanks to all of you who worked on this...Good Job! Download the TerraGo Toolbar to measure and GPS track on the map.

Labels: ,

Tuesday, January 13, 2009

BrightKite and Emergency Response

I've mentioned before how Twitter is being used to send out updates based on live events from the field that anyone in the world can access. With that said, posting a comment with pictures (and other media) along with a location is an emerging pheonomenon on the web known specifically as a Location Based Service (LBS). There are many of these LBSs to choose from but the one that has really caught my attention is called BrightKite. This small startup out of Colorado enables users from anywhere to "check in" to a location and then share their experience with other users in the same general area. Moreover, it allows you to create a private friends list which keeps you in touch with people who might have similar interests (like a group of first responders during a major natural disaster!). They also feature the BrightKite Wall which is a  utility that broadcasts what is going on with your list of BrightKite buddies through a simple flash-based interface. This is a cool feature but I don't have enough buddies setup to see any kind of real action. There are literally dozens of applications for this technology and I would encourage everyone to check it out...How can your company use a Location Base Service like BrightKite? I would love to hear from you!

Labels: ,

Monday, January 12, 2009

GeoPDF to TIFF

There has been a decent number of inquiries lately about exporting GeoPDF to TIFF. You can do this quite easily out of the box using Acrobat version 9.0 Pro Extended. Simply open your GeoPDF file in APEX and export it out as either a TIFF or JPEG2000 image. 

Once the image has been exported from APEX, you can bring it in to other software applications for further processing and analysis. See the IMAGINE GLT below...

There are a few more options available to you for this so please feel free to ask!

Labels: , ,